RT Studio Guide
This section provides a detailed guide for using RT Studio for development and testing. For guidelines on project creation and scripting, please consult the Developer Reference.
RT Studio is a powerful tool for developing, testing, and debugging CVEDIA-RT solutions. It offers a visual interface to configure analytics, manage instances, and visualize output data.
Installation
RT Studio Installation
RT Studio for Windows is an add-on installer available from the CVEDIA-RT download page. It requires a working installation of RT Server.
To install RT Studio:
- Download and run the installer of RT Server for Windows or Linux
- On Windows download and run the RT Studio installer.
Development Mode
RT Studio can run one instance without a license for evaluation and development purposes.
License Requirements
Production deployments require license activation. Premium analytics (ALPR, Armed Person, Fallen Person) require additional licensing. A 30-day trial includes all features. See License Management for details.
RT Studio: Working with Solutions and Instances
When using RT Studio for development and testing, you'll work with Solutions (templates) and Instances (running configurations).
Understanding the Interface
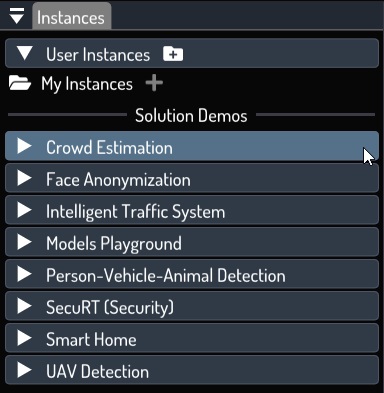
The Instances panel displays all user-created instances and currently loaded solutions with their demo instances.
Starting an Instance
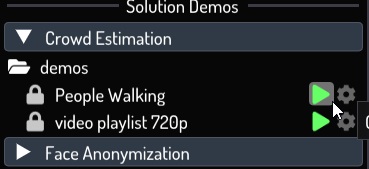
Clicking on a solution folder reveals all the instances associated with that solution:
Clicking on the ▶ button of an instance, CVEDIA-RT will load all the AI modules and scripts associated with it.
When the instance is started, CVEDIA-RT starts processing all the related scripts. This will usually produce data in the output sink that can be visualized in the Output and Data panels, and exported in different ways.
Tip
You can run multiple instances at once by pressing the Ctrl key while clicking on the ▶ icon.
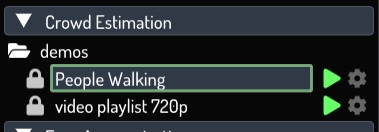
Instance state
The currently selected instance will be highlighted with a green box.
An instance can be started, paused, and stopped. Additionally, when an instance is paused, you can step frame by frame for debugging purposes.
Creating Custom Instances
You can create new instances in the User Instances section of the Instances panel.
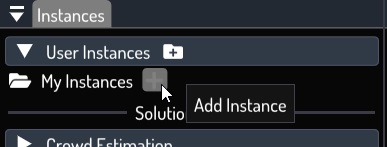
You will be prompted to choose a name and the Solution to base the instance on.
After confirming these data, a new Setup window will appear that allows you to configure many different options.
The only required setting is the Source, where you can specify the input stream from various types.
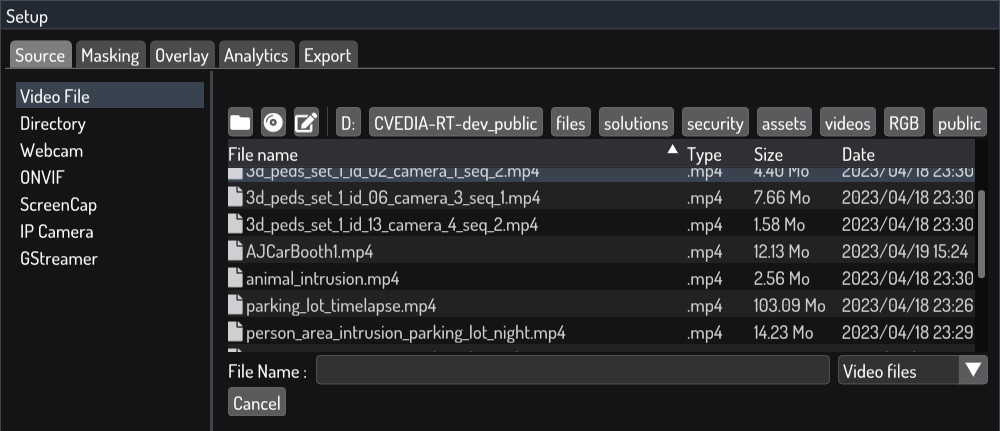
For more information on all the different source types, please check the Source Selection page.
RT Studio Configuration
For visual configuration in RT Studio:
- Open the Analytics Setup panel
- Draw detection zones and tripwires
- Configure analytics rules
- Save instance configuration
RT Studio Panels
After starting an instance, you will have a new blue entry in the top menu called "Instance":
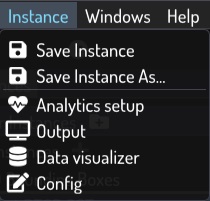
From here you can save the current instance settings (it's grayed out when an instance is in read-only mode), or save a new instance with a different name.
Also, you have access to a few panels that you can open and dock in the user interface.
Analytics setup
The Analytics setup panel allows previewing the input stream and configuring different types of analytics by drawing areas, and tripwires, and setting all the relevant options.
Note
Please note that each solution has a different set of options you can configure.
By clicking on the cog of an area or a tripwire, you can access additional settings specific to that analytics.
Important
To make your settings persistent, click on the top menu item Instance -> Save Instance before stopping the running instance.
Output
The Output panel renders the inference results from the instance's process pipeline, like bounding boxes, counters, detected classes, etc...
In some solutions, it's also useful to inspect in more detail the internal data used by the solution, like the motion buffer and regions, raw untracked detections, etc.
In the left menu, it's possible to configure what and how to render the data, and save presets for different visualization styles.
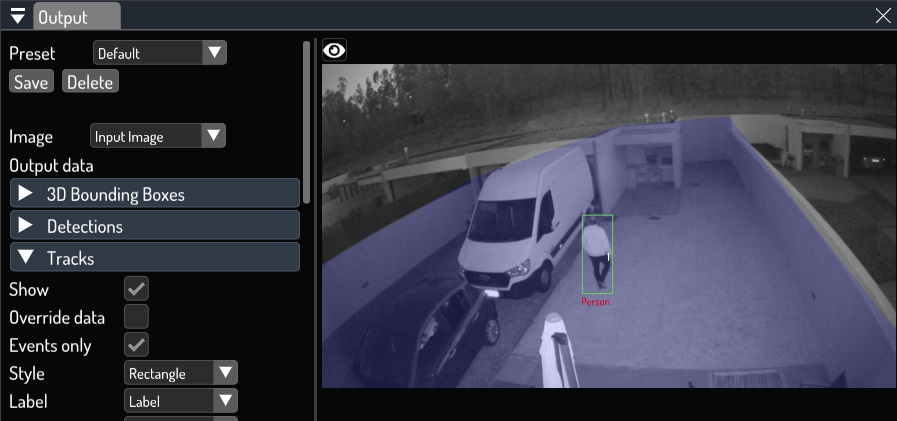
For more information check the Output Preview page.
Data Visualizer
The Data visualizer panel displays the events and other types of data that result from the instance's process pipeline.
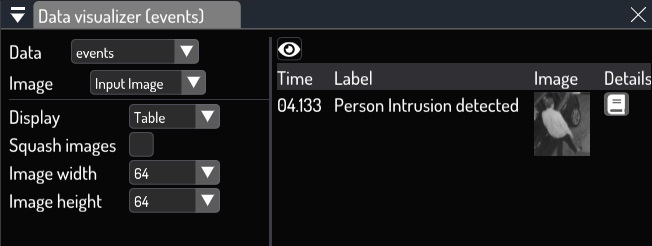
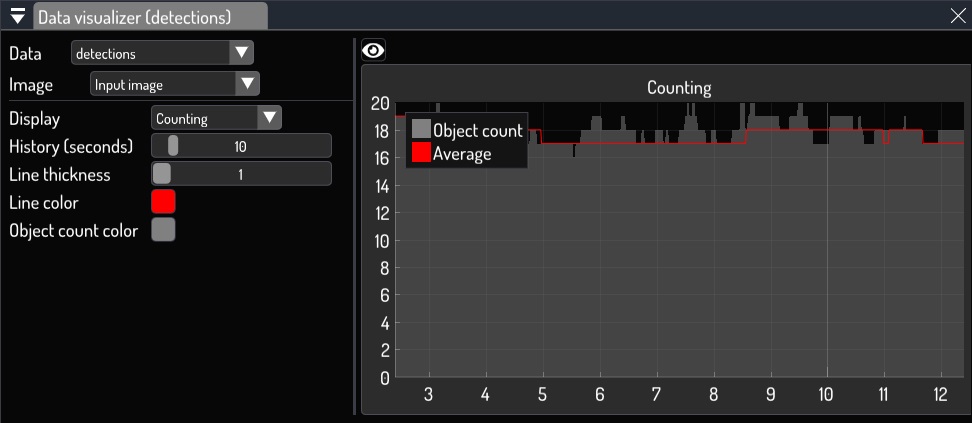
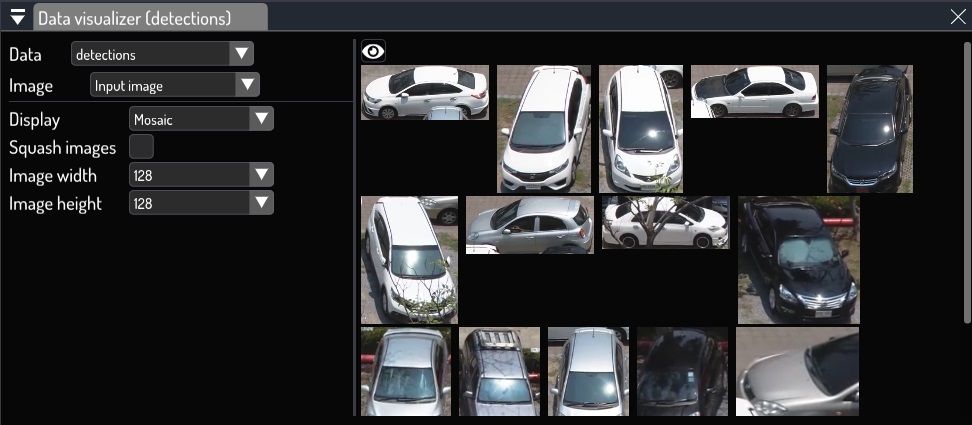
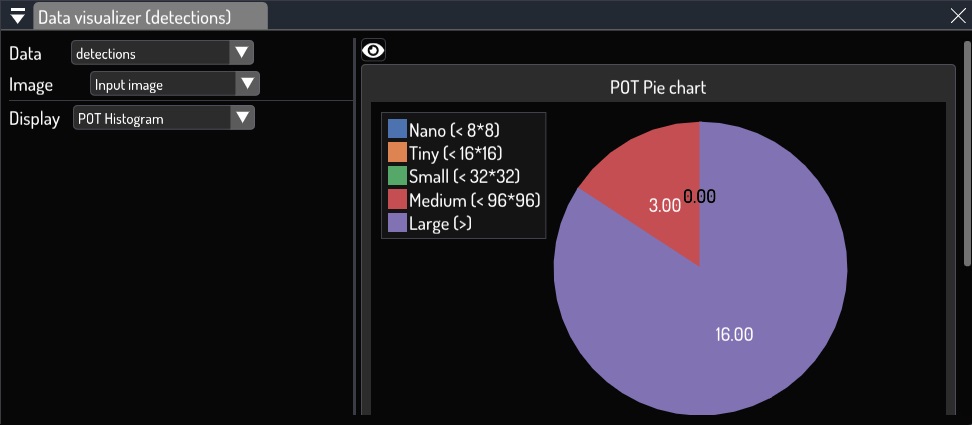
For more information check the Data Visualizer page.
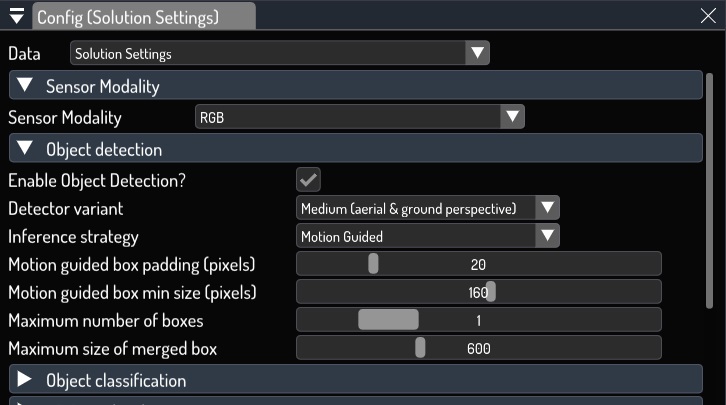
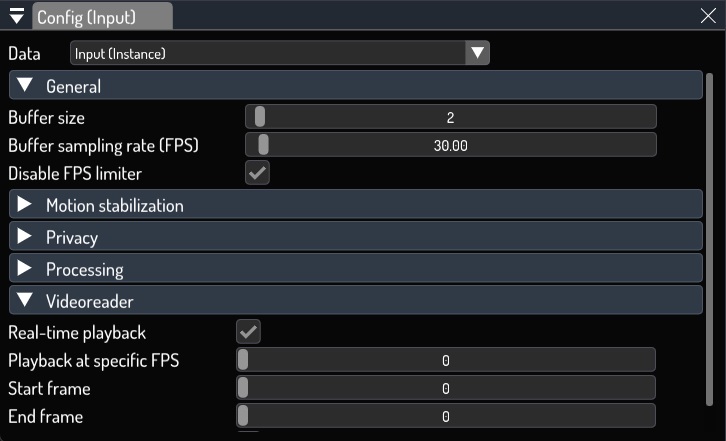
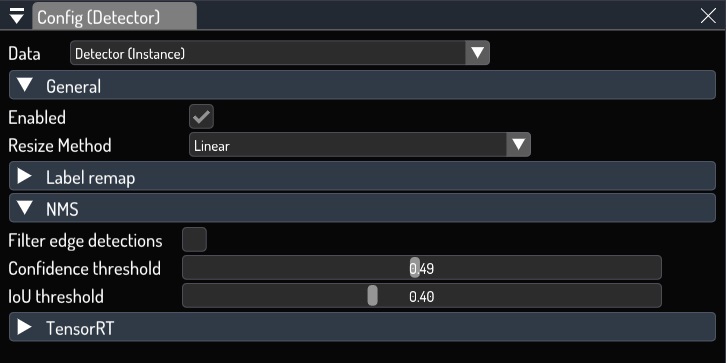
Config
The Config panel exposes the generic settings of the instance and of the loaded modules.
From the Data dropdown, you can access the Solution Settings and all the configurable modules.
Each module has a different configuration panel. Check the Modules section for more information.
Important
To make the changes made in the Config panel persistent, click on the top menu item Instance -> Save Instance before stopping the running instance.
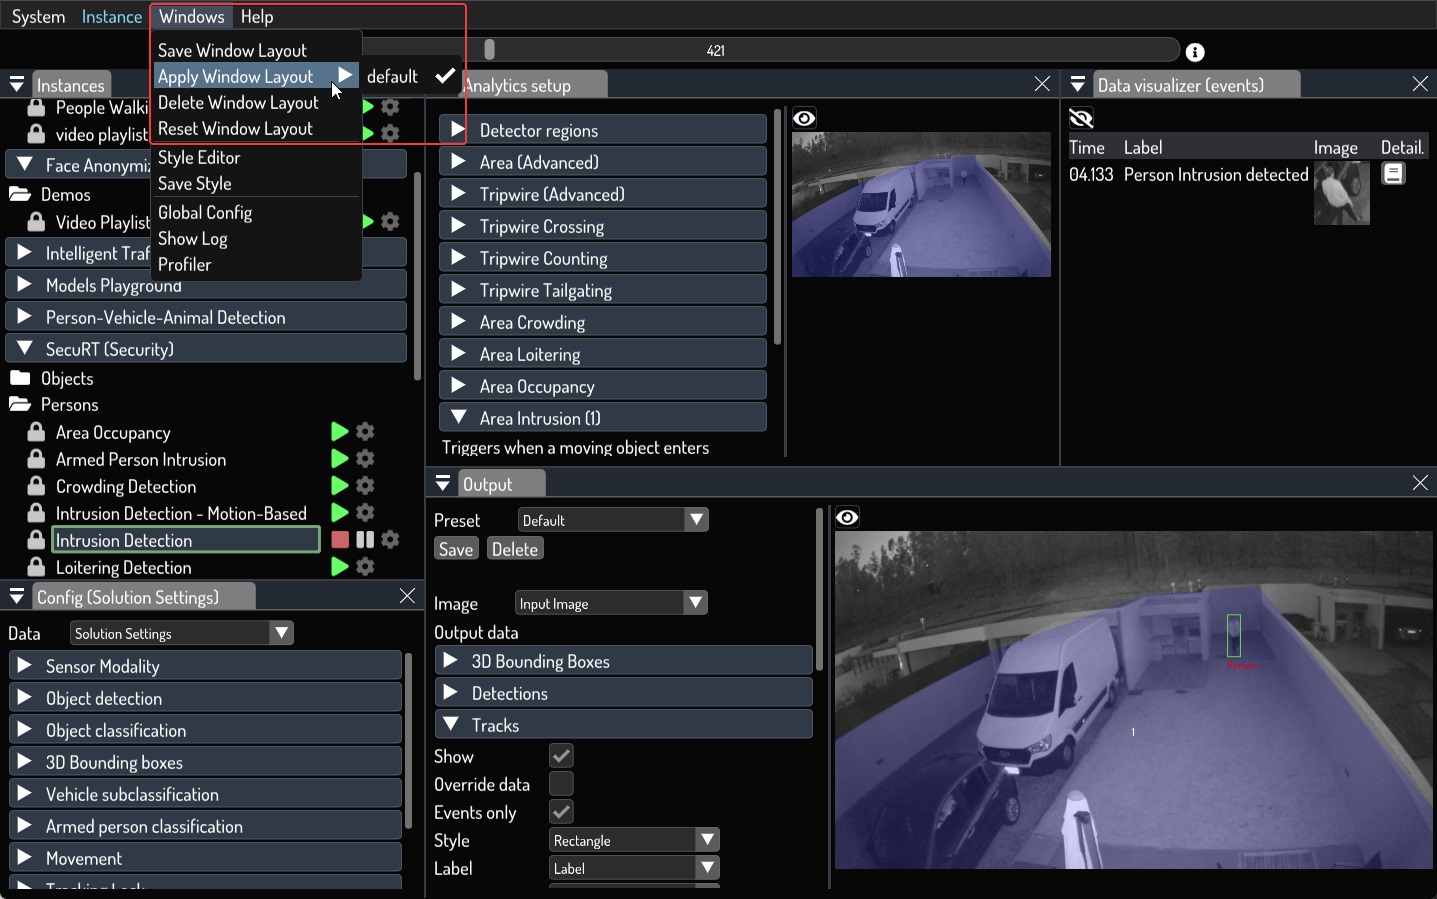
Managing panels
CVEDIA-RT UI allows you to rearrange all the opened panels as you prefer. To better improve usability, all the windows are dockable and resizable, allowing multiple UI configurations.
UI configuration can be saved by clicking on the top menu item Windows -> Save Window Layout. It's also possible to save multiple layouts and later switch between them.
Tip
It's also possible to open multiple panels of the same type simultaneously to compare different data of the currently running instance.