Tracy Profiler
General info
CVEDIA-RT offers an integration with Tracy Profiler. This profiler can uncover valuable debug information.
You can download the releases here: https://github.com/wolfpld/tracy/releases.
- For version
2023.5.xand newer, download version 0.10. - For version
2023.4.xand older, download version 0.9.1.
Warning
As of 2024.1.2 tracy support is restricted to dev builds
Running Tracy Client
To run Tracy, use Tracy.exe from the release archive. This binary file can run in Wine on Linux systems.
If you are running CVEDIA-RT inside a Docker environment (./run.sh), you might need to append -- --network=host to the ./run.sh command (see ./run.sh --help for more info) to enable port forwarding outside the docker container.
Connecting to CVEDIA-RT
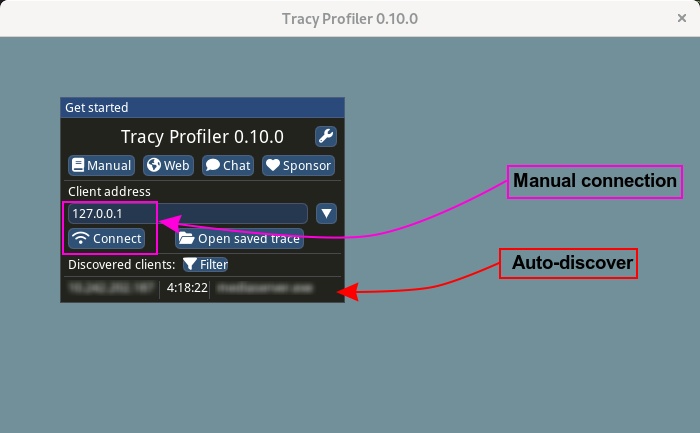
Once the Tracy is running, you can connect to the running instance of the CVEDIA-RT.
It should auto-discover CVEDIA-RT. If needed, you can specify the IP address where CVEDIA-RT is running.
Watching and saving the trace
Once you are connected, you can watch the performance of a certain block of code or see additional performance statistics. Additionally, if CVEDIA-RT crashes, you can also view the stack trace.
Info
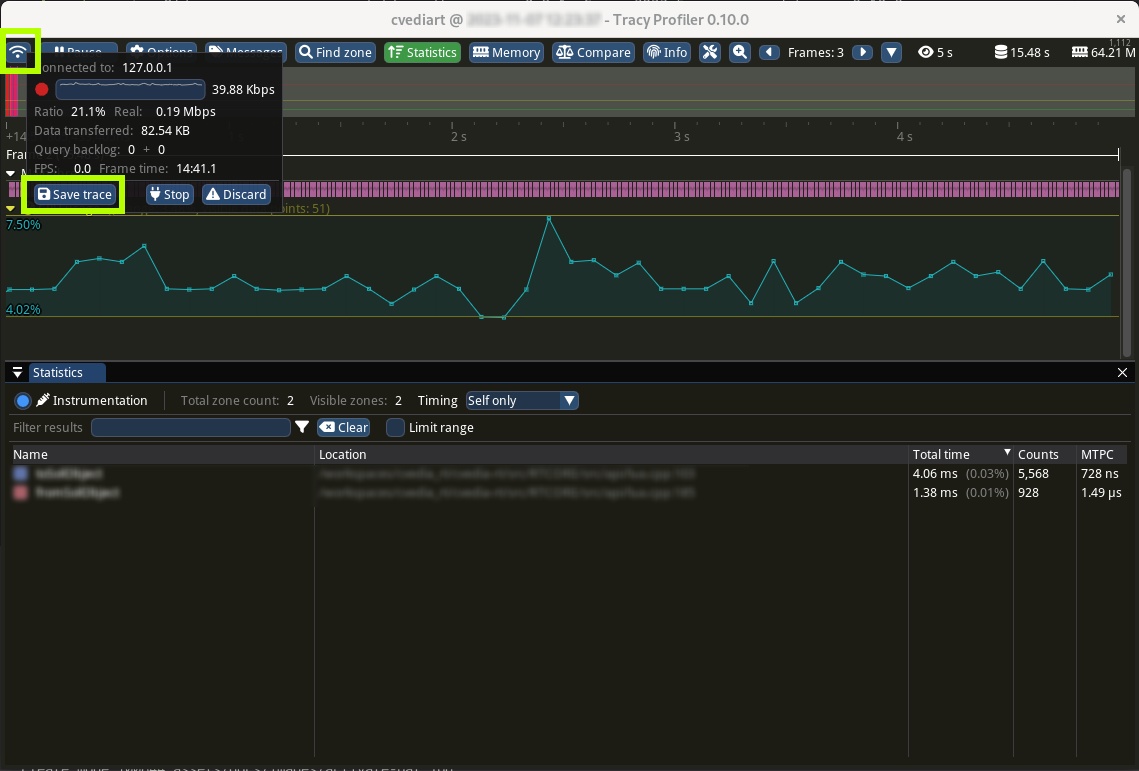
To see the data collected by the profiler, click the Statistics button on the top bar.
During the connection, Tracy is recording the provided information that we can use for debugging. To save it, click the "WiFi" button in the top left corner. And then save the trace to a file on disk.
This is the file to attach to the support requests whenever needed.
Known issues
On some hardware, Tracy Profile could fail with this error:
Tracy Profiler initialization failure: CPU doesn't support invariant TSC. Define TRACY_NO_INVARIANT_CHECK=1 to ignore this error, if you know what you are doing.
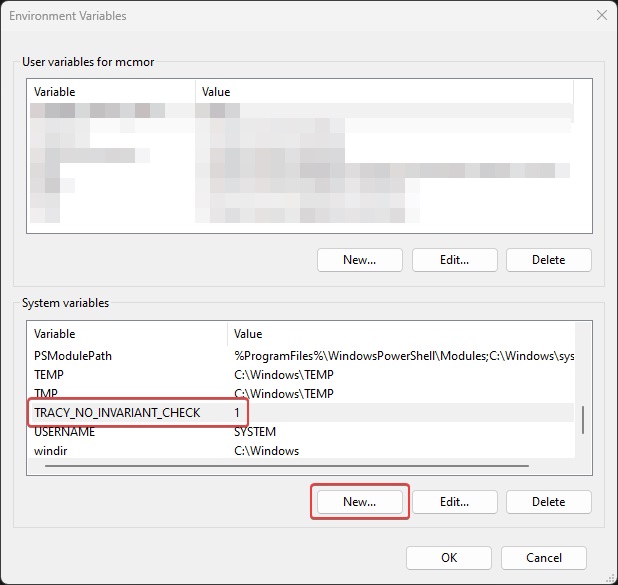
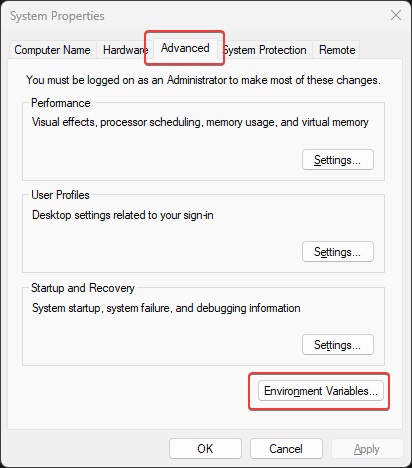
In this case open the System Properties to edit Environment Variables:
Click 'New...' and name it 'TRACY_NO_INVARIANT_CHECK' and give it value '1':