Profiling
CVEDIA-RT allows profiling the instances, gathering information about timings in realtime.
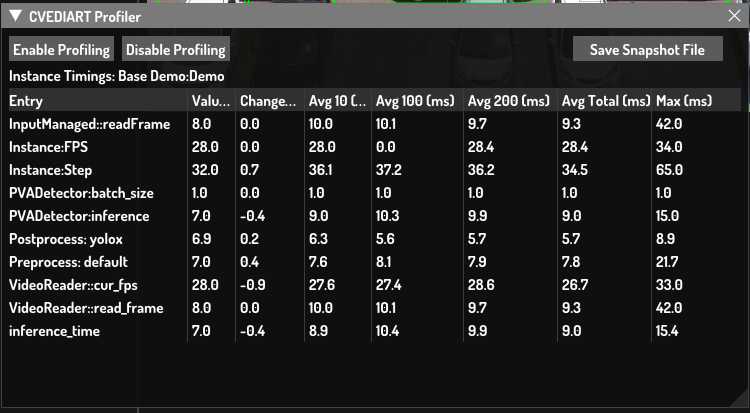
Profiling Window
CVEDIA-RT's gathered data can be viewed on the Profiler Window, when this window is open the profiling system is enabled and CVEDIA-RT starts gathering data. Otherwise the system is not active, so that it doesn't affect performance.
Profiling Counters
System Counters
Multiple modules and CVEDIART internal functionalities have profiling counters already defined, when the profiling system is activated this will start collecting data, for example the inference system collects timings on how long does an inference operation takes in ms.
User Defined Counters
CVEDIART scripting system allows creating and accessing custom profiling counters with specific Lua functions:
rt:writePerformanceCounter : Write a value to a PerformanceCounter (This will show up on the Profiling Window)
rt:writePerformanceCounter("counter_name", counter_value_float)
rt:getAllPerformanceCounters : Get a table will all PerformanceCounters (Including Global ones)
rt:getAllPerformanceCounters()
rt:getInstancePerformanceCounters : Get a table with the Instance PerformanceCounters
rt:getInstancePerformanceCounters()
getAllPerformanceCounters Table Structure
{
  lua = {}, // Lua related counters
  rt = {  // Instance counters
    ["InputManaged::readFrame"] = { 7.0, 0.0, 7.8000001907349, 0.0, 8.7538461685181, 4226.0, 9.3751249313354, 67.0, 0.0 },
    [counter_name] = { Latest Value, Avg50 , Avg10, Avg100, AvgTotal, Total Samples count, Total Avg Since Start, Max Since Start }
  }
}
rt Lua variable
In this case, the rt Lua variable presented represents the instance variable returned from rt = api.thread.getCurrentInstance()
Demo - Output Profiling Data with sinks
This Demo showcases how it's possible to output profiling data using the sink and Output handler system from CVEDIA-RT
Instance Json - ProfilerDemo.json
This json configures an instance with a Video File input and a Json Output that's attached to the profiler sink, it also uses the assets/scripts/profiler_output.lua to process the data that is fed to the output
{
    "Input": {
        "config": {
            "media_type": "Video File",
            "uri": [
                "ffmpeg:///assets/videos/demo.mp4"
            ]
        }
    },
    "Output": {
        "handlers": [
            {
                "sink": "profiler",
                "uri": "json:///output/detector_outputs.json",
                "config": {
                    "script": "assets/scripts/profiler_output.lua"
                }
            }
        ]
    }
}
Instance Code - index.lua
The Lua code for the instance will be based on a simple detector but will define a new sink called profiler, which will receive the data from the profiler counters, then, because we have an Output Handler attached to the profiler sink, we can output that data to a json file, passing it first through the profiler_output.lua script.
dofile(luaroot .. "/api/api.lua")
dofile(luaroot .. "/profiler.lua")

-- Declare and initialize global instances and modules
---@class rt_instance
rt = api.thread.getCurrentInstance()
---@class inferencemanaged
detectInst = api.factory.inference.create(rt, "PVADetector")
---@class inputmanaged
input = api:loadInput("Input")
---@class outputmanaged
output = api:loadOutput("Output")

function onStartInstance(name, config)
    rt:registerSink("Output")
    rt:registerSink("profiler")
    rt:createWorker("myworker1", "onInit", "onRun")
end

function onInit()
    -- Load Input source from configuration on the system
    input:setSource()
    -- Load Output source from configuration on the system
    output:setSource()

    -- Load Detector model on the system
    detectInst = sapi.createBackend("auto://pva_det/rgb/small/220204", "PVADetector", 1)

    Profiler.Init(sapi)
    Profiler.Enable()

    -- Start performance counter system (Otherwise its only enabled when we open the Profiler window)
    rt:setPerformanceCounterState(true)
    return true
end

function onRun(currentTime)

    -- Get next frame, if the instance is paused we must ignore the skip_frame functionality
    local inputimg = input:readFrame(rt:isPaused())
    if inputimg ~= nil and inputimg:is_valid() then

        local outputimg = inputimg:copy()

        -- Start measuring performance counter
        Profiler.TraceStart("detection_time")

        -- Run detector
        local detections = detectInst:runInference({ x=0, y=0, width=1.0, height=1.0, relative=true, source=inputimg })

        -- Write performance counter with detection time interval (Calls rt:writePerformanceCounter("detection_time",value) internally)
        Profiler.TraceInterval("detection_time")

        if detections ~= nil then
            for _, d in pairs(detections) do
                outputimg:drawBoundingBox(d.x, d.y, d.width, d.height, string.format("%s (%.2f)", d.label, d.confidence), {0, 255, 0}, 1)
            end
        end

        rt:writeToSink("Output", {image = outputimg, meta=detections})

        -- Write performance counter data to the profiler sink
        rt:writeToSink("profiler", {meta=rt:getAllPerformanceCounters()})

        rt:stepThread()
    end

    return true
end
Script Code - assets/scripts/profiler_output.lua
The Output Handler will look for a script in assets/scripts/profiler_output.lua to process the data. This script will simply take the metadata provided and output the detection_time field that we created manually, as well as an endline char.
function outputHandlerProcess(metadata)
    if metadata == nil then
        return {}
    end
    local last_value_column_index = 1
    return metadata.rt["detection_time"][last_value_column_index] .. "\n";
end
outputHandlerProcess
All the scripts defined in the Output Handler section will look for a function called outputHandlerProcess in the file, only this function will be run.